This guide introduces the fundamental steps to process seismic refraction tomography with smartTomo software. The demo version is distributed with a pre-loaded dataset. The characteristics of the dataset are described in this article (Demo version).
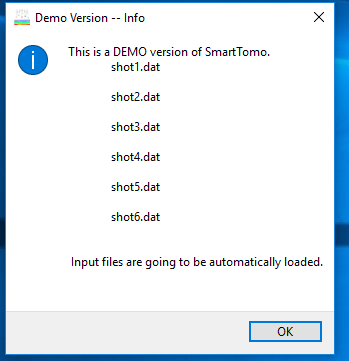
At startup the following screen appears reminding you that this is a demo version and it shows the list of files that will be loaded.
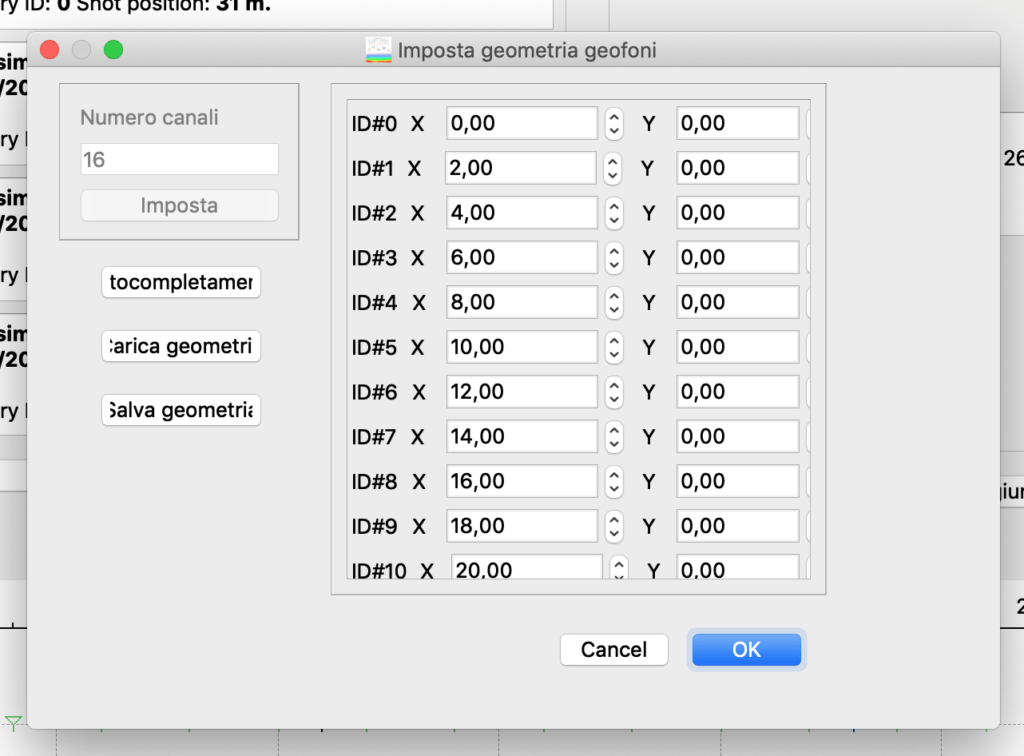
After pressing OK, the dialog box will be displayed and the can set the geometry of both shots and geophones.
On the left side of the window the positions of the shots are listed while the summary of the locations of the geophones are shown on the left. It is possible that for the same processing there are several groups of geophones, for example when performing an acquisition with a work-away configuration.
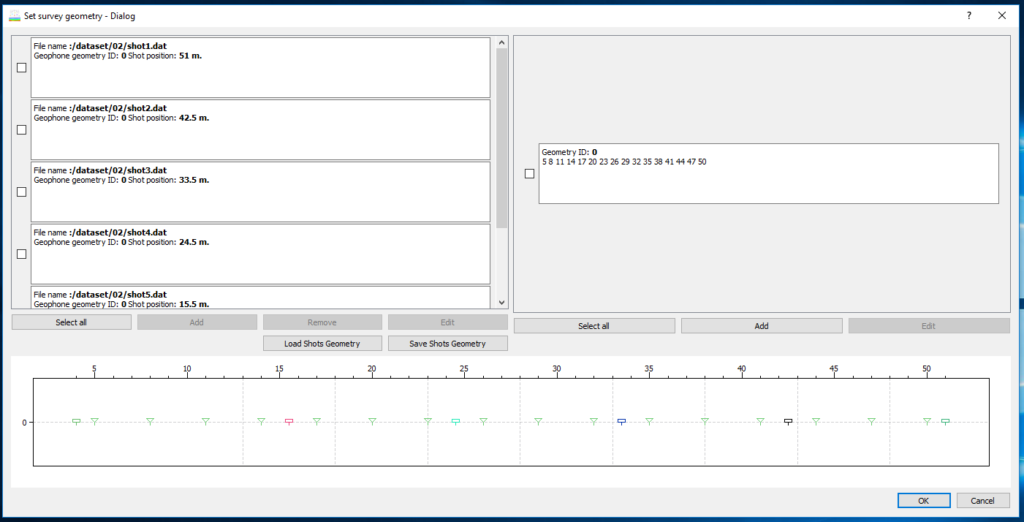
Selecting the check box on the left of the geophones enables the edit button with which you can view in detail and edit the position of the geophones. The same can be done for the shots.
Both geophone and energisation geometry can be loaded from a CSV file. For geophones a file with only X and elevation, while for shots a file with three columns: one for shots id and then for X and elevation.
After accepting the geometry with OK, a dialog box opens to select the parameters related to the grid of the tomographic section.
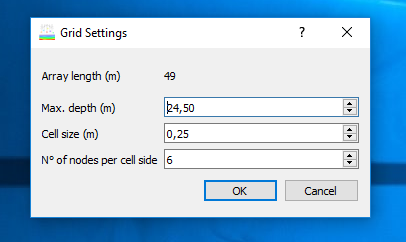
The maximum depth is set by default to half the length of the seismic line. The cell size is set to 0.25 meters, but even higher values may be acceptable, especially for long seismic lines. It is generally recommended not to choose values greater than a quarter of the intergeophonic distance.
The number of nodes per side of the cell indicates how detailed the synthetic travel times will be. A number between 6 and 11 may be acceptable for most situations. Increasing the number of nodes also increases the memory required for processing. After this step, the main window of the program will be displayed.
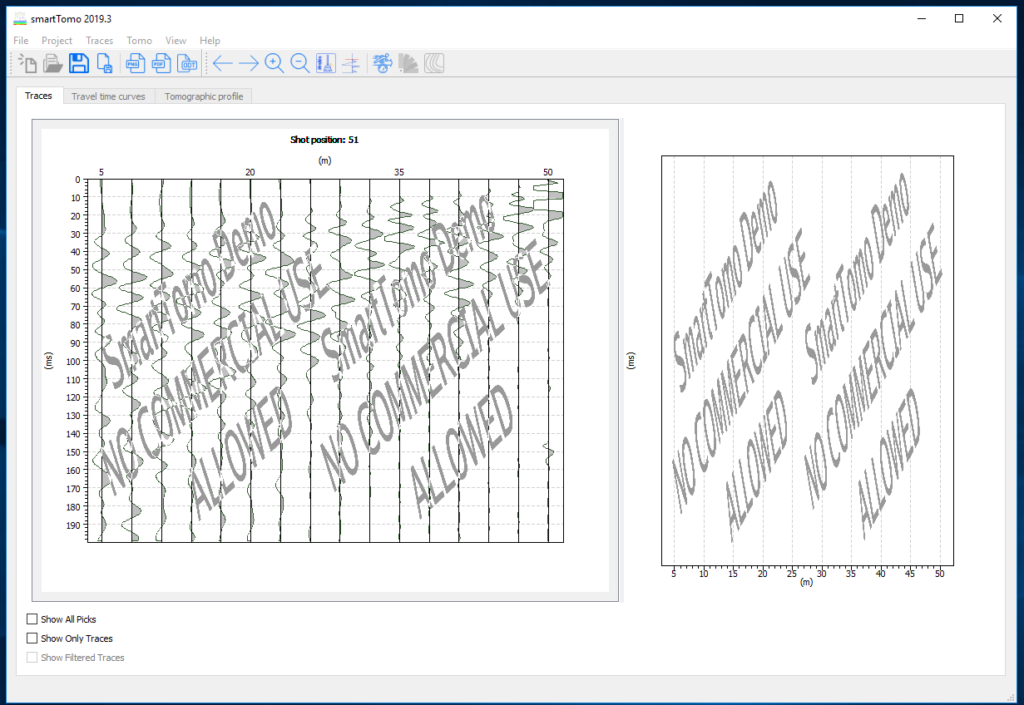
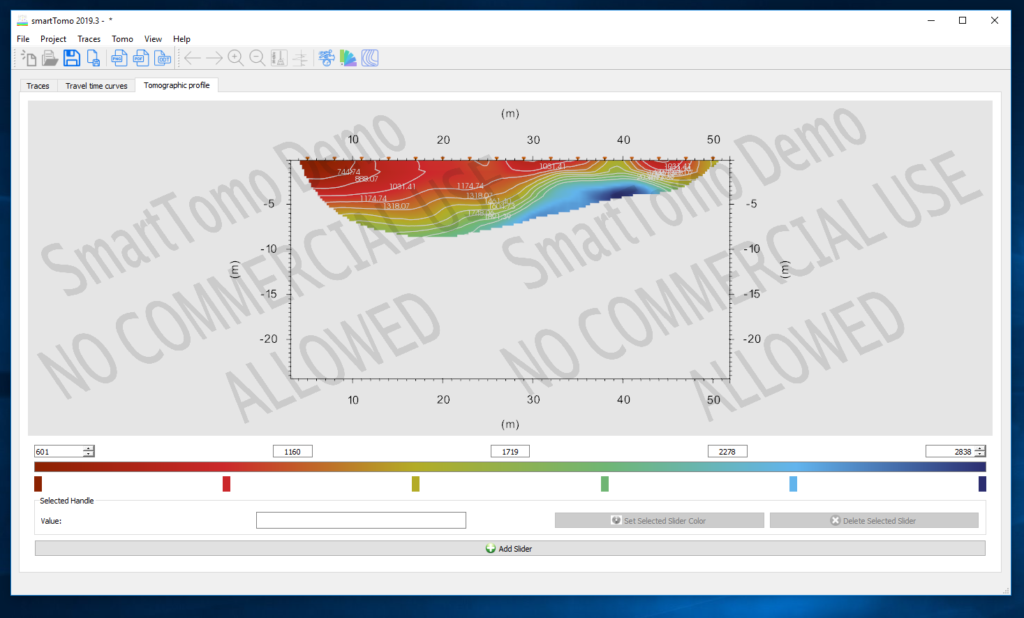
There are three tabs: the traces, the traveltime curves and the tomographic profile. At startup only the display of the tracks will be enabled. Completing the picking of the first arrivals will also enable the display of traveltime and finally after the tomographic inversion has been completed will also be available the profile display tab.
The selection of the first arrivals can be made manually by clicking on the trace or automatically. This mode implements the signal energy ratio method with a control to reduce abnormal “crazy” picks. If an automatically selected first arrival does not fall within a speed range compatible with the propagation of a seismic wave in the ground, the first arrival will be disabled (the trace will be colored red). To activate a disabled channel, it is sufficient to select it in manual mode by setting the first arrival time.
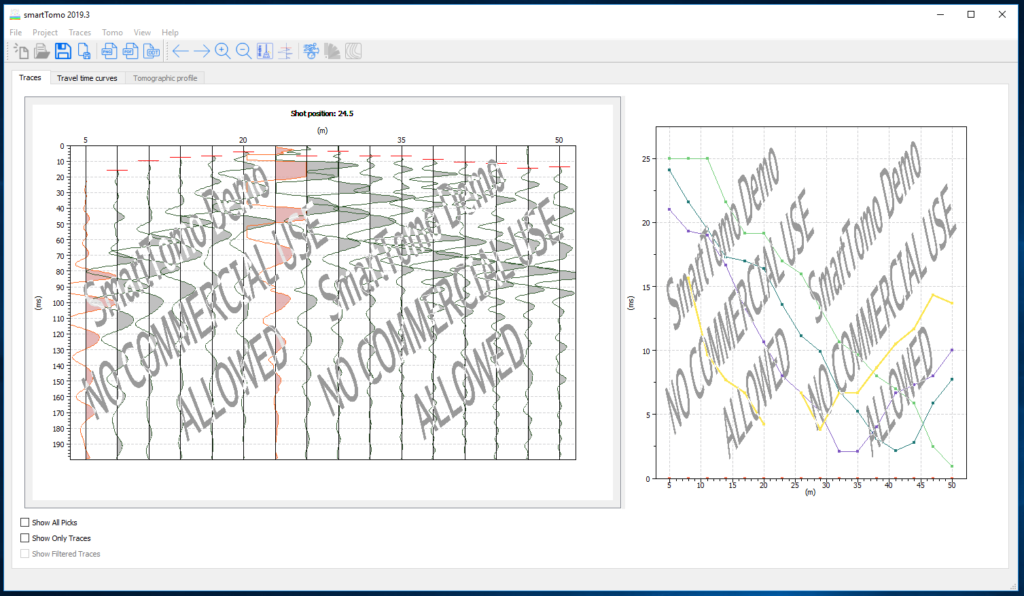
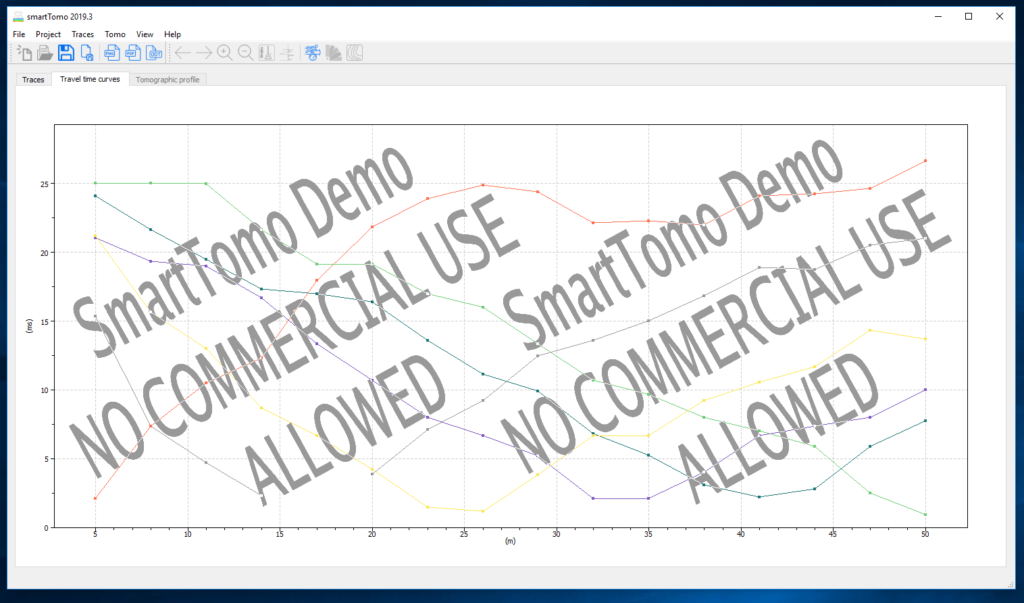
On the right side of the window there is a preview of the dromochronous in order to have an overview of the sampling of the first arrivals. The second tab allows the visualization of the dromochronous as they were sampled and, after the calculation of the tomographic section, also the synthetic dromochronous measured on the tomographic model made.
To start the tomography inversion it is necessary to click on the appropriate icon or in the “Tomo” menu. A dialog box will open allowing you to select different parameters.
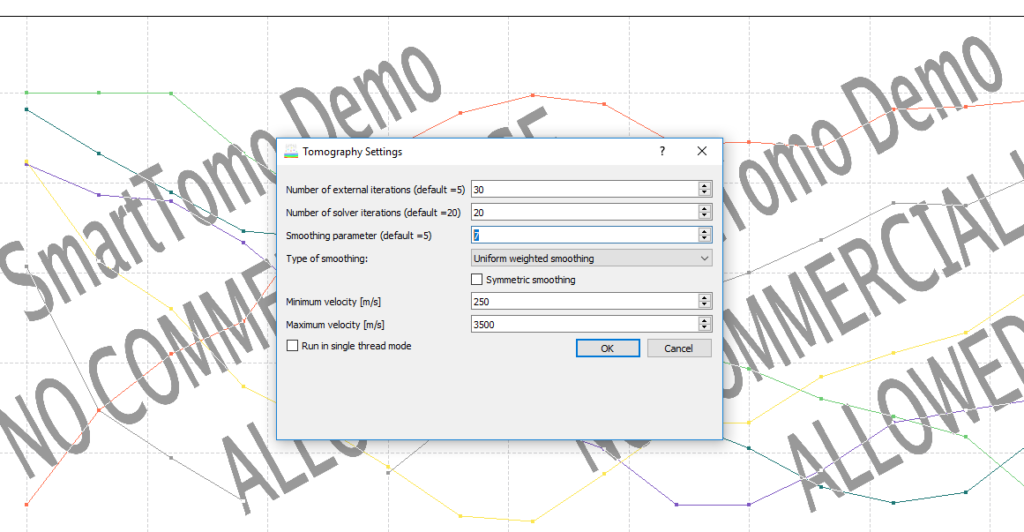
From the dialog that opens, you can set the number of iterations of the solver, the smoothing parameter and the expected speed limits. The smoothing parameter determines how much the update of the calculation matrix is extended to adjacent cells. High values (8-10 produce more homogeneous profiles). The minimum and maximum speeds are the limits within which the tomographic profile is updated.

After processing therefraction tomography, the result is displayed on the “tomographic profile” tab. The default view presents the tomographic section with overlapping seismic rays in order to evaluate which portions of the section have a greater meaning because they are crossed by multiple rays. The view can be customized by changing the color palette and you can view the lines of iso-speed. In the software there are some predefined palettes and new ones can be defined according to the user’s needs. SmartTomo includes the Viridis and Magma palettes, which are homogeneous to perception and also suitable for viewing by colour-blind users (more information).